How to Create and Manage Relationships in Power BI
TABLEAU / POWERBI


Are you ready to embark on a journey of transforming raw data into actionable insights using Power BI? As a beginner, understanding how to create and manage relationships between data tables is your passport to unlocking the full potential of this powerful tool. In this comprehensive guide, we'll walk you through the process of building relationships in Power BI, empowering you to weave together diverse data sources into a cohesive narrative.
If you want to follow up with today’s exercise, you can access tables below:
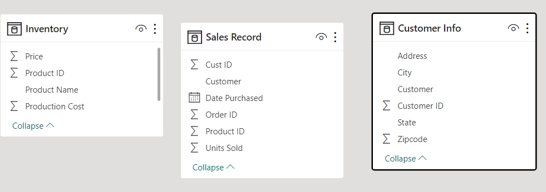
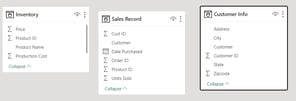
To understand the data, we have 3 tables for our Food Supply distributor:
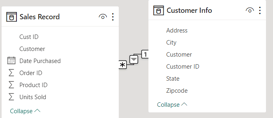
Customer Info: Customer ID, customer name, address, city, state, zip code.
Sales Record: Customer ID, customer name, product ID, order ID, units sold, date purchased.
Inventory: Product ID, product name, price, production cost.
What are Relationships in Power BI?
Picture this: you have multiple datasets that hold valuable pieces of information. Relationships are the bridges that connect these datasets, allowing you to navigate seamlessly between them. They form the backbone of your data model, making it possible to analyze, visualize, and make informed decisions.
Step 1: Preparing Your Data
Before diving into relationships, make sure your data is imported and organized within Power BI. Each dataset should ideally be represented by a distinct table. For instance, for today’s exercise, we have tables for customers, sales, and inventory.
Load all 3 tables into Power BI as they are. No transform is necessary.
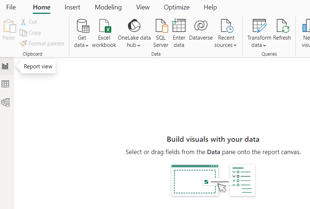
Step 2: Navigating the Data Model View in Power BI
Navigate to the "Data" view within Power BI. This is where the magic happens! You'll see your tables and columns displayed like pieces of a puzzle, waiting to be connected.
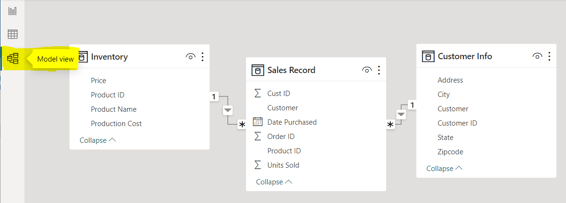
The lines we see connecting the tables, are already relationships that Power BI has automatically detected and created.
Step 3: Defining Relationships in Power BI
The line between tables gives us the relationship information.
If you like this content and want to learn more, you might also read:
Essential Technical Skills for Data Analysts
Power BI with SQL for Beginners
Power BI: Data Insights for Smarted Decisions
Convert Pivot Tables with Power Query to Import into Power BI
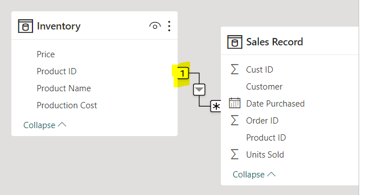
-> 1 means, 1 to many relationships, and a single cross filter direction between tables.
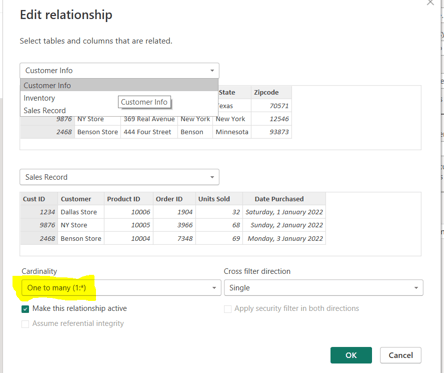
When we double click on the line that connects ‘SALES RECORD’ and ‘CUSTOMER INFO’ tables, a ‘EDIT RELATIONSHIP’ page appears.
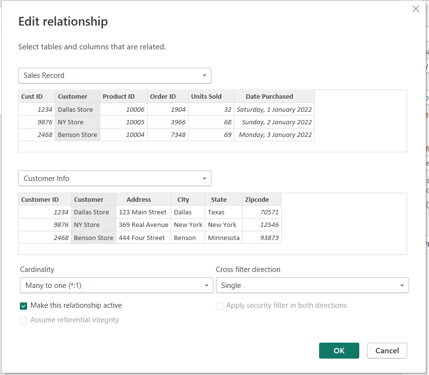
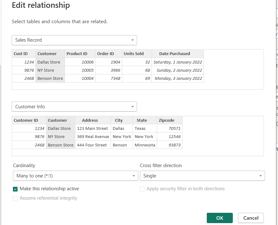
Edit Relationship page in Power BI
‘EDIT RELANTIONSIP’ page is a feature that allows us to fine-tune and customize the relationships we've established between different tables in your data model. This page provides us with a comprehensive set of options to control how data flows between tables and how filters are applied.
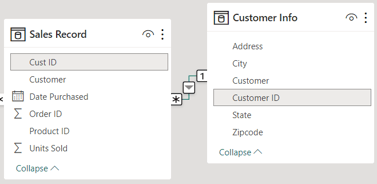
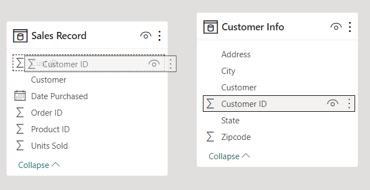
In this page, we can see the columns that Power BI choose to connect the 2 tables together, which is ‘CUSTOMER’, however, let’s say we want to remove ‘CUSTOMER’ information from ‘SALES RECORD’ leading to ‘CUSTOMER ID’ as the connecting column.
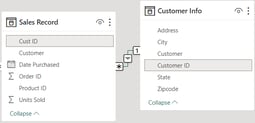
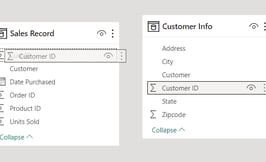
To do that, let’s click on both ‘CUST ID’ and 'CUSTOMER ID’ columns and click ‘OK’.
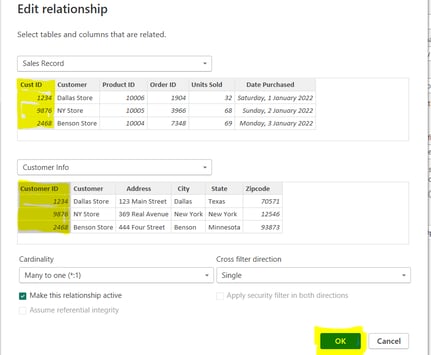
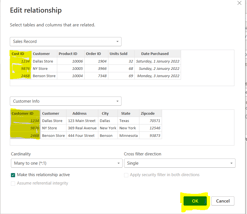
Now, we can see that the relationship is based on these columns.
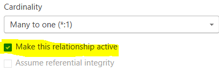
Cardinality in Power BI
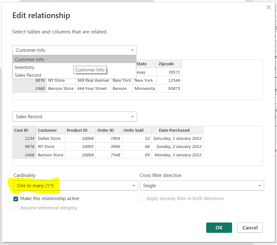
Let’s open the ‘EDIT RELATIONSHIP’ between ‘SALES RECORD’ and ‘CUSTOMER INFO’, to check ‘CARDINALITY’. It describes the nature of the relationship in terms of "One" or "Many" associations between tables.
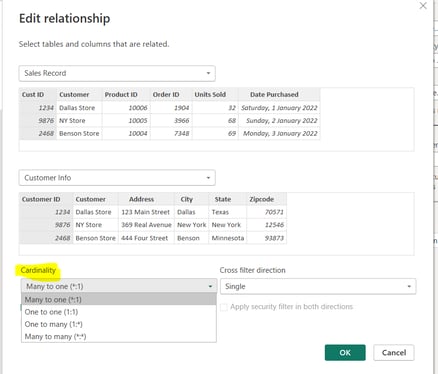
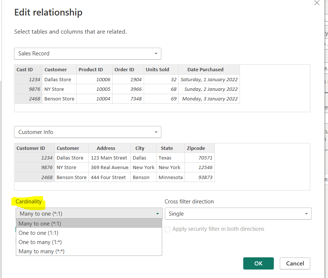
For this example, we are looking at ‘SALES RECORD’ down to ‘CUSTOMER INFO’.
There are many rows in ‘SALES RECORD’, but very few in ‘CUSTOMER INFO’ and only one customer per row.
While in ‘SALES RECORD’ we have several rows for several different orders. And that’s why cardinality is many to one.
Let’s flip it, putting ‘CUSTOMER INFO’ first, second ‘SALES RECORD’. Then, clicking on ‘CUSTOMER ID’ and ‘CUST ID’ to create a relationship.
Notice that cardinality now is one to many.
Cross filter direction in Power BI

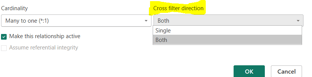
Decide how filters flow between tables:
Opt for "Single" to have filters from the primary table influence the related table.
Choose "Both" for filters to flow in both directions.
This feature decides how filters influence our tables. Choose "Single" if we want filters from one table to affect the related table, and "Both" if we want a two-way filter flow.
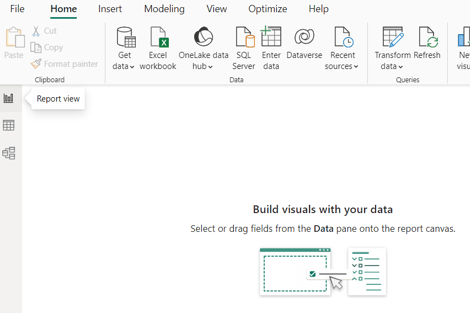
To better understand it, go to ‘REPORT VIEW’ and let’s build visualization.
We want to connect ‘INVENTORY’ and ‘CUSTOMER INFO’.
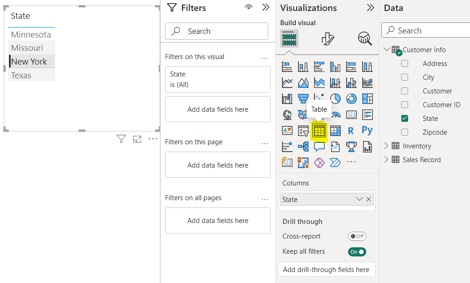
To start, let’s select ‘STATE’ and make it a table.
Notice that ‘CUSTOMER INFO’ table is only connected to ‘SALES RECORD’ table for now.
Let’s go to ‘INVENTORY’ to see how many ‘PRODUCT ID’ were bought in these different states.
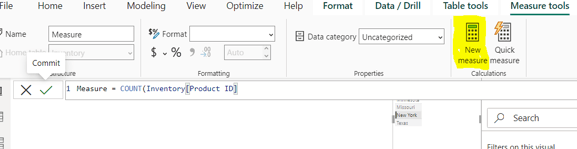
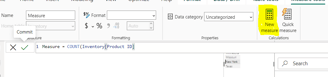
So, let’s create a new measure where the count of ‘INVENTORY’ ‘PRODUCT ID’
The created measure will appear in ‘INVENTORY’ data. Let’s add it to the table by clicking on it.
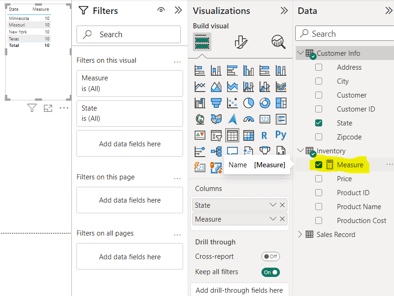
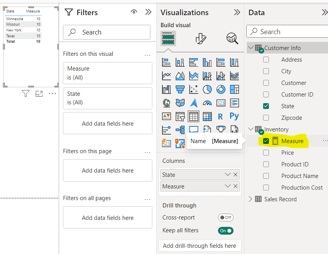
The result is 10 ‘PRODUCT ID’ for each state. When we analize it, we can see it is not correct because not every state purchased these 10 different items.
If we go back to our model and change the cross filter direction to ‘both’ instead of ‘single’ between the tables (‘INVENTORY’ and ‘SALES RECORD’ / ‘SALES RECORDS’ and ‘CUSTOMER ID ‘).
Then go back to visualization measure table, we can see that Minnesota only ordered 7 different product IDs, Missouri 8, New York 9, and Teas 10.
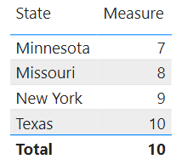
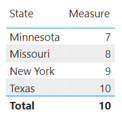
This result is the most accurate one because when we use the ‘both’ option, it takes these tables and treats them as they are single table. Which is the ‘single’ option does not do it.
Active or Inactive relationship in Power BI
By default, relationships are created as active. You can deactivate a relationship temporarily if needed.
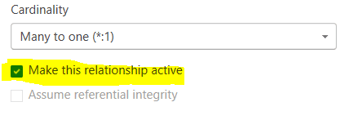
If we unclick it, and there are other options that connect the columns, then that may be the active relationship. However, if its checked, means it will become the default relationship between the 2 tables.
Build Relationships in Power BI from Scratch
Even though Power BI does a great job to create relationships between tables, learning how to create them from scratch is good way to understand every single part of the process.
Let’s delete their relationships.
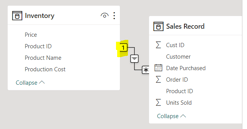
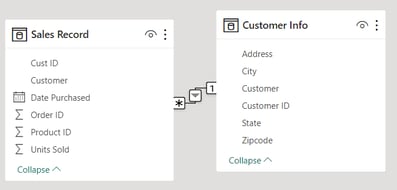
When we drag ‘CUSTOMER ID’ from ‘CUSTOMER INFO’ table on top of ‘CUST ID’ of ‘SALES RECORD’, it will automatically create the relationship.
Let’s open the ‘EDIT RELATIONSHIP’ and change cross filter direction to ‘both’.
Then drag ‘PRODUCT ID’ from ‘INVENTORY’ into ‘PRODUCT ID’ in ‘SALES RECORD’, and also change cross filter direction to ‘both’.
It creates the relationship we had in the beginning.
Of course, more tables we have, more complex it gets as more relationships are created but it is an overview of how we are going to create relationships in the model tab within Power BI.
Creating and managing relationships is like composing a symphony—each note (table) harmoniously blending with others. As you embark on your data journey, mastering relationships will empower you to craft captivating data stories, transforming complex data into actionable insights. Armed with this knowledge, you're well on your way to becoming a data-driven storyteller using Power BI.